Clustering: WCSS and Elbow method


Unsupervised machine learning unlocks hidden patterns within data!
The “Elbow Method” 🧐 is a vital tool in this realm. It helps us find the optimal number of clusters, paving the way for better insights and smarter decision-making. Discovering structure in the unstructured!
Clustering is one of the most well-known and commonly used unsupervised machine learning techniques, but it is not the only one. Unsupervised learning encompasses a broader category of algorithms beyond clustering. Here are some other types of unsupervised learning algorithms:
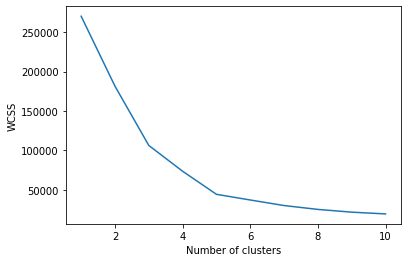
The Elbow plot for optimal K means selection.
1. Dimensionality Reduction:
*Principal Component Analysis (PCA): PCA is used to reduce the dimensionality of data while preserving as much variance as possible.
*t-Distributed Stochastic Neighbor Embedding (t-SNE): is used for visualizing high-dimensional data in lower-dimensional space, making it easier to explore and understand the underlying structure.
2. Anomaly Detection:
*Isolation Forest: This algorithm is used to identify anomalies or outliers in data by isolating them in binary trees.
These are just a few examples of unsupervised learning techniques. Unsupervised learning is a diverse field with various algorithms designed for different types of tasks, including clustering, dimensionality reduction, anomaly detection, and more.
Now let’s discuss the importance of WCSS and the Elbow method for clustering.
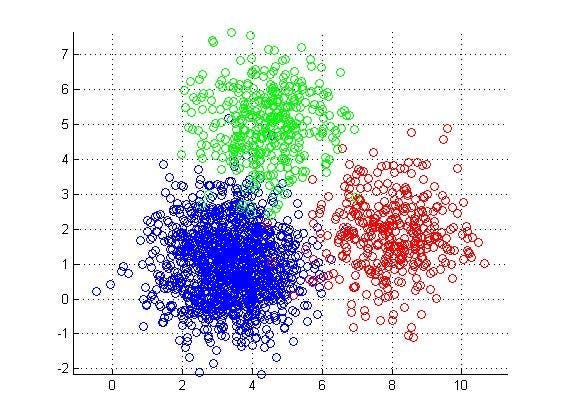
The Within-Cluster Sum of Squares (WCSS) and the Elbow Method are important concepts in the context of clustering algorithms, especially for techniques like K-Means. WCSS is a measure of the compactness or cohesion of clusters in a clustering algorithm, particularly K-Means. It quantifies how close data points within a cluster are to the centroid of that cluster.
Elbow Method:
The Elbow Method is a heuristic used to determine the optimal number of clusters (k) for a clustering algorithm, such as K-Means. It involves plotting the WCSS for a range of k values and looking for an “elbow” point on the graph. The idea is that the point where the rate of decrease in WCSS sharply changes (forming an elbow-like shape) is a good choice for the number of clusters.
Here’s how to use the Elbow Method:
Fit the clustering algorithm (e.g., K-Means) to your data for a range of k values.
For each k, calculate the WCSS.
Plot the number of clusters (k) against their corresponding WCSS values. Look for the “elbow” point in the plot. The location of the elbow is the suggested optimal number of clusters.
Interpreting the Elbow Method:
If the plot resembles an elbow, where WCSS sharply decreases up to a certain point and then starts to decrease more slowly, that point is typically chosen as the optimal k.